Research-backed calculator guide
Azure OpenAI Region Selection: Latency vs Price Evidence Pack
A reproducible way to compare Azure OpenAI region and deployment choices using measured latency, model availability, quota scope, and token-price evidence.
Quick answer
There is no honest single table that tells you the “cheapest and fastest Azure OpenAI region.” A useful Azure OpenAI region latency price comparison has to join four separate observations: the client-to-endpoint latency you actually measure, the deployment type’s processing boundary, the model and deployment availability in the candidate region, and the token or capacity rate that applies to that SKU. Global, Data Zone, and geography-based deployments are different routing and data-processing choices, not interchangeable names for a physical region. Microsoft’s deployment guidance also distinguishes pay-per-token Standard from reserved-capacity Provisioned options and lower-cost Batch processing. [3]
For a first pass, run the same workload against every eligible candidate, record p50 and p95 time to first response and time to last token, and keep input and output token counts beside each latency observation. Microsoft defines total response time as TTLT = TTFT + (TBT × Tokens Generated), so a longer answer can be slower even when the deployment has not regressed. [2] Then calculate monthly cost from the same token mix, rather than comparing input prices from one model with output prices from another.
The decision rule is simple: reject candidates that fail residency, availability, quota, or SLO constraints; among the feasible candidates, compare cost per workload at the same model, token mix, and service tier. Treat any number you have not measured as an estimate. Azure’s published prices are estimates rather than a customer quote, and Microsoft notes that agreement, purchase date, currency, and offer can change the amount shown. [1]
Run your scenario
Turn this framework into an editable estimate.
Use dated, source-linked assumptions and see cost per request, successful task and month.
What “region” means in an Azure OpenAI comparison
People often use “region” to mean three different things. First is the Azure geography where a geography-based deployment keeps processing. Second is the data-processing boundary: Global can route through any supported Azure region, while Data Zone stays within a defined zone such as the United States or European Union. Third is the client’s network path to the service, which depends on where users, private networking, DNS, gateways, and the serving capacity happen to be. Conflating these creates a false promise that choosing an Azure region automatically produces a known round-trip time.
Microsoft’s deployment comparison labels Global Standard as processing in any Azure region, Data Zone Standard as processing within a data zone, and Standard as processing within an Azure geography. The same table also separates pay-per-token billing from reserved PTUs and identifies Batch as a lower-cost, asynchronous option. [3] A region-selection record should therefore contain deployment_type, processing_boundary, candidate_region_or_zone, model_version, and billing_mode as separate fields.
Availability is another independent filter. Not every model supports every deployment type, and Microsoft directs readers to its model-availability information for the current region and deployment matrix. [3] A candidate that looks attractive on price is not a viable comparison row if that exact model version and SKU cannot be deployed where you need it. Record the date and the portal result when checking availability because these are operational facts that change.
Quota scope can also change the practical meaning of “another region.” Microsoft’s quotas guidance says some models use subscription-level pools across regions for Global Standard or within a data zone for Data Zone Standard, while other limits are defined per region, subscription, model, or deployment type. [4] Moving traffic to a second region may improve network proximity, but it may not create a second independent quota pool. Capture the quota page’s scope value before treating multi-region failover as additional capacity.
A reproducible measurement protocol
Start with a workload profile, not a region list. Write down the model and version, deployment type, prompt size distribution, expected output size, cache-hit assumptions, requests per minute, concurrency, streaming setting, and client location. Use a fixed test set that represents production prompts. If you change the prompt, output cap, model, or streaming mode between candidates, the result is a workload comparison rather than a region comparison.
Use at least two client vantage points when the application serves more than one market. A U.S.-based test cannot establish the experience of a European or Asian user. Run warm-up calls separately, then collect a sufficient sample during comparable load. Store timestamps in UTC, request ID, candidate deployment, model version, input tokens, generated tokens, TTFT or time to response, TBT, TTLT or time to last byte, HTTP status, and retry count. Do not average retries into a “latency” number without also reporting the retry rate.
For streaming traffic, prioritize time to response and TBT because users see the first chunk before the final token. For non-streaming traffic, TTLT is the more direct end-to-end measure. Microsoft’s latency guidance maps Azure Monitor metrics to these concepts and recommends pairing latency with generated-token and processed-prompt-token metrics. [2] A five-second response that generates 2,000 tokens is not evidence of the same bottleneck as a five-second response that generates 50 tokens.
A compact evidence row can look like this:
| Candidate | Client vantage point | Deployment and boundary | Model/version | p50 TTFT | p95 TTLT | Generated tokens | Availability/quota check | Monthly token estimate |
|---|---|---|---|---|---|---|---|---|
| East US | New York, US | Standard / US geography | Same pinned version | measured | measured | measured | portal checked on test date | formula result |
| West US | New York, US | Standard / US geography | Same pinned version | measured | measured | measured | portal checked on test date | formula result |
| Global Standard | New York, US | Global | Same pinned version | measured | measured | measured | global quota scope recorded | formula result |
The table is a template, not a claim that these candidates have any particular latency. Replace “measured” with your captured values. If a candidate returns a 404, unavailable-model message, quota error, or 429 under the same test, retain that result as evidence rather than quietly dropping the row.
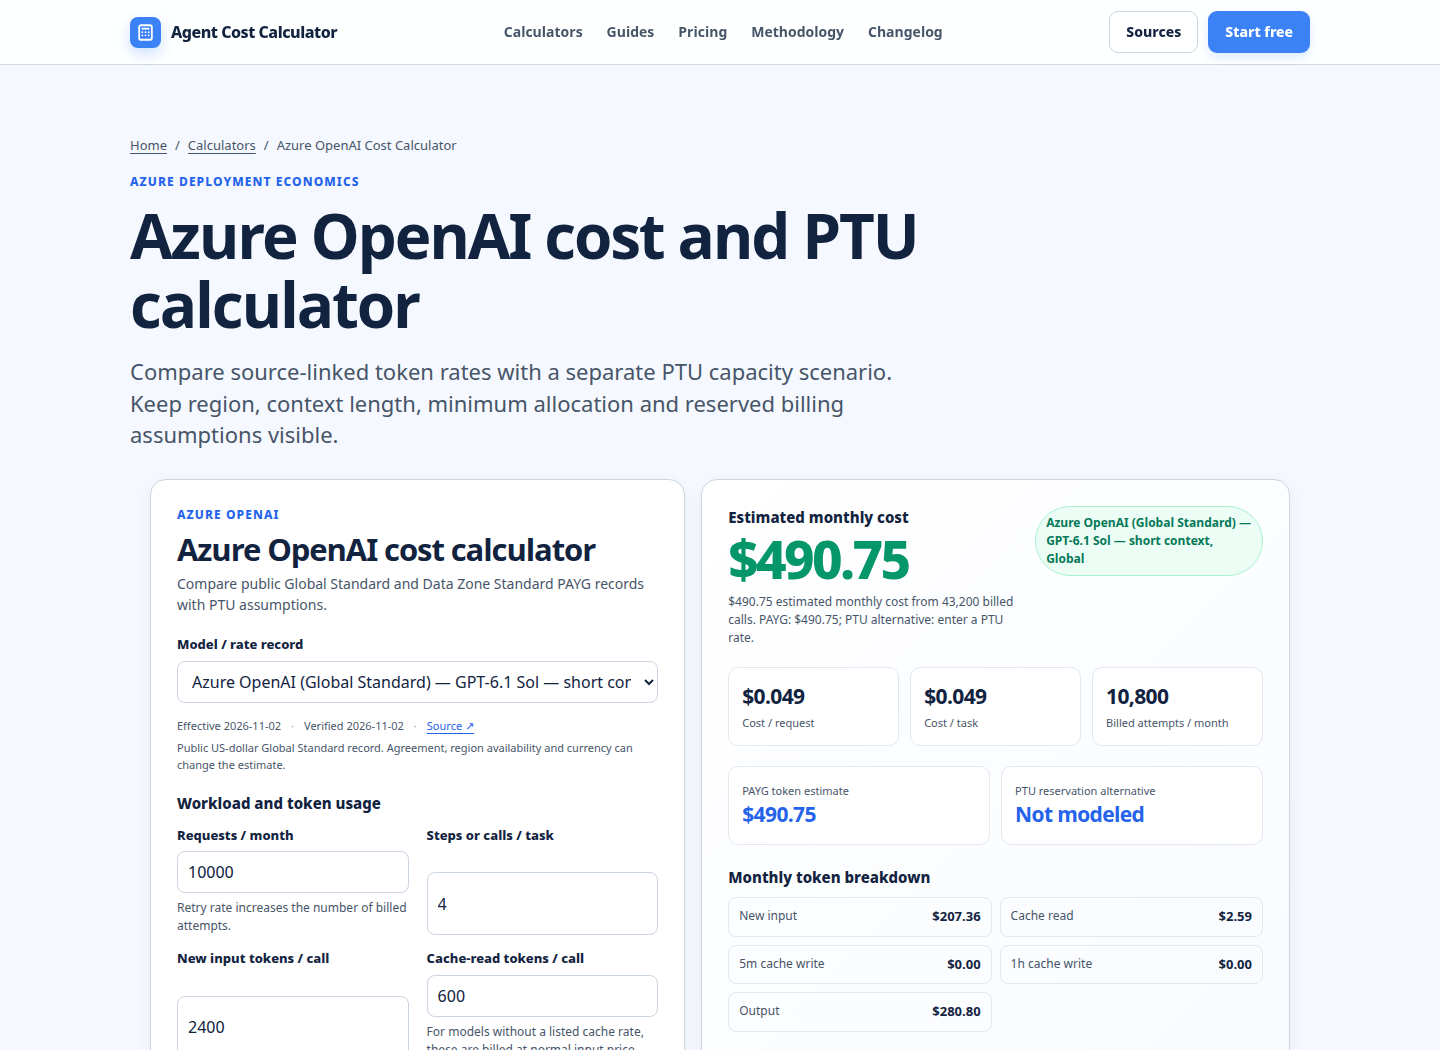
The existing Azure OpenAI cost calculator screenshot illustrates why the price record needs visible assumptions: request volume, steps or calls, input tokens, cache-read tokens, model/rate record, and effective date all affect the estimate. It is a cost-input demonstration, not a latency benchmark and not proof of a vendor quote.
Worked cost example
Assume one month of production traffic uses the same GPT-5.1 model family and the same workload in two eligible pay-as-you-go deployment profiles:
- 5,000,000 new input tokens per month.
- 1,000,000 output tokens per month.
- No cache-read tokens, batch discount, priority-processing premium, tax, network charge, or PTU reservation.
- USD list-price estimate checked on 2026-11-02.
The Azure OpenAI pricing page lists GPT-5.1 Global at $1.25 per 1 million input tokens and $10 per 1 million output tokens. It lists GPT-5.1 Data Zone at $1.38 input and $11 output per 1 million tokens. [1] Applying those rates:
| Input | Output | Global Standard estimate | Data Zone estimate |
|---|---|---|---|
| 5M input tokens | 1M output tokens | 5 × $1.25 + 1 × $10 = $16.25 | 5 × $1.38 + 1 × $11 = $17.90 |
| Difference | — | — | $1.65 more, or about 10.2% above Global |
The arithmetic says the Data Zone estimate is $1.65 higher for this token mix. It does not say Data Zone is worse. If a residency requirement makes Global unacceptable, the relevant comparison is Data Zone against other compliant choices. If a measured latency SLO requires a different tier, compare that tier’s rate and behavior instead of selecting a cheaper but infeasible profile.
The estimate also scales with the workload. At 500M input and 100M output tokens with the same mix, multiply both estimates by 100: Global becomes $1,625 and Data Zone becomes $1,790 before taxes or other charges. This is why a small per-million-token price difference can matter for a high-volume service, while a latency improvement can be worth more than the delta if it prevents abandoned sessions or extra application retries. Any business value attached to that latency must be modeled separately; it is not included in the token bill.
Do not blend this pay-as-you-go example with PTU economics. Provisioned deployments reserve throughput capacity and require a separate capacity and reservation assumption. The official Foundry pricing page likewise presents model rates and provisioned options as separate pricing surfaces. [5] For a finance-ready check, send the same assumptions to the AI API invoice reconciliation calculator after traffic is live.
Turn latency into a comparable decision
Use a hard-constraint sequence. First, remove candidates that fail data-processing or residency requirements. Second, remove model and deployment combinations unavailable in the target region or zone. Third, check quota scope, TPM, RPM, concurrency, and expected burst behavior. Fourth, compare p95 time to response or TTLT against the user-facing SLO. Only after those filters should price become the tie-breaker.
For example, suppose a controlled test produces the following illustrative values for the same prompt set. These numbers are placeholders for a measurement record, not Microsoft results or a regional guarantee:
| Candidate | p50 TTFT | p95 TTLT | Monthly token estimate | Constraint result |
|---|---|---|---|---|
| Global Standard | 310 ms | 1,480 ms | $16.25 | passes residency only if global processing is allowed |
| Data Zone Standard | 330 ms | 1,620 ms | $17.90 | passes U.S. data-zone requirement |
| Regional Standard | 360 ms | 1,700 ms | $18.40 | passes geography requirement, if model is available |
The correct conclusion depends on the requirement. A product with a 1,800 ms p95 limit might accept all three and choose based on residency, availability, and cost. A product with a 1,500 ms p95 limit cannot treat Data Zone or Regional as interchangeable with Global, even if their average is close. If a later test shows output tokens rose, apply Microsoft’s TTLT formula before labeling the deployment slower. [2]
For consistent high volume, evaluate Provisioned deployment types separately because Microsoft describes them as reserved throughput with more predictable latency variance, while Standard is best-effort and can vary with workload and load. [3] The comparison needs an apples-to-apples utilization assumption: reserved PTUs that sit idle are not equivalent to pay-as-you-go tokens that are only charged when consumed.
A practical evidence pack should contain the raw request sample, a summary by candidate, the Azure portal availability result, quota-scope screenshot or export, the pricing URL and effective date, and the formulas used for monthly cost. Keep vendor list prices separate from observed network or application costs. The latter may include gateway, private-link, logging, retries, and egress decisions that are outside the model token rate.
Common comparison mistakes
Comparing regions with different model versions. A newer version can have a different token rate and inference profile. Pin the model deployment name and version, then record any automatic version behavior.
Using one ping as the latency benchmark. ICMP or a single HTTP request does not represent token generation. Measure the actual API request with representative input and output, and report percentiles.
Reporting average latency without token counts. Output length is a major driver of TTLT. Keep generated tokens next to every percentile.
Assuming Data Zone means one fixed datacenter. Microsoft describes zone routing and can add regions to zones as capacity changes. [3] Record the deployment boundary and test date rather than naming an implied serving facility.
Treating published price as an invoice. Azure says the pricing display is an estimate and that agreements, date, currency, and offer may change the actual amount. [1] Reconcile usage and invoice data after launch.
Ignoring quota behavior. A second endpoint may share a Global or Data Zone quota pool, or may be constrained by a regional scope. [4] Confirm scope before promising failover capacity.
For token assumptions and rate normalization, the AI token cost calculator can help make input, output, and cached-token units explicit. For a broader provider decision, use the LLM cost calculator alongside this region evidence rather than substituting a generic monthly estimate for measured latency.
FAQ
Is a closer Azure region always faster?
No. Client-to-region network distance is only one component. Model processing time, generated-token count, queueing, deployment load, routing behavior, private networking, and retries also affect the observed result. Measure the real API path from representative clients and report percentiles with token counts.
Does Global Standard have a fixed latency or serving region?
No fixed latency should be inferred from the label. Microsoft describes Global deployments as dynamically routed through Azure’s global infrastructure and notes that high-volume workloads can see more latency variation. [3] Record the deployment type and your measured result; do not convert the label into a regional millisecond promise.
Is Data Zone always more expensive than Regional Standard?
Not as a universal rule. Rates depend on the model, version, deployment type, and current price card. The worked example shows a GPT-5.1 Data Zone versus Global difference using the rates visible on 2026-11-02, but it is not a quote for every model or region. Check the exact SKU and price date before deciding.
How many latency samples do I need?
There is no universal sample count that proves a production SLO. Use a representative prompt set and enough calls to estimate the percentiles you operate against, including warm-up, concurrency, time of day, and retry behavior. If traffic is multi-market, test each important client vantage point; one U.S. test cannot stand in for global users.
Can I use token price alone to choose between Azure regions?
No. Price is a useful feasibility and sensitivity input, but a candidate can fail residency, model availability, quota, throughput, or p95 latency requirements. Filter those constraints first, then compare cost for the same input/output mix and billing mode.
When should I compare PTU rather than pay-as-you-go?
Compare PTU when traffic is sustained and predictable enough that reserved throughput may be utilized. Model the PTU commitment, minimum allocation, utilization, overflow or spillover, and measurement window separately from token rates. Do not present a PTU estimate as a pay-as-you-go quote; Microsoft documents Provisioned as a separate reserved-capacity deployment path. [3]
Limitations and update policy
This page records a method and an illustrative calculation, not a live regional benchmark. Prices, model availability, deployment types, quota scopes, and Azure routing behavior can change. Recheck the official pricing and documentation pages on the date of a purchasing decision, retain the checked date, and rerun the workload from the clients that matter. The search benchmark below describes the result formats inspected on 2026-11-02 in English, United States; it does not provide search volume, ranking forecasts, or a claim that any competitor is absent.
Primary sources checked
Pricing and product behavior can change. These sources support the time-sensitive claims in this guide; verify current provider terms before committing spend.