Research-backed calculator guide
GPU Inference TCO Calculator: Cost per Million Tokens and Utilization
Calculate self-hosted GPU inference TCO, estimated output capacity, and cost per million generated tokens from your quote, measured throughput, utilization, and monthly overhead.
Quick answer
A useful GPU inference estimate needs two measured boundaries: what you pay for the running accelerator and how many output tokens your serving stack produces under the workload you actually care about. The calculator uses this model:
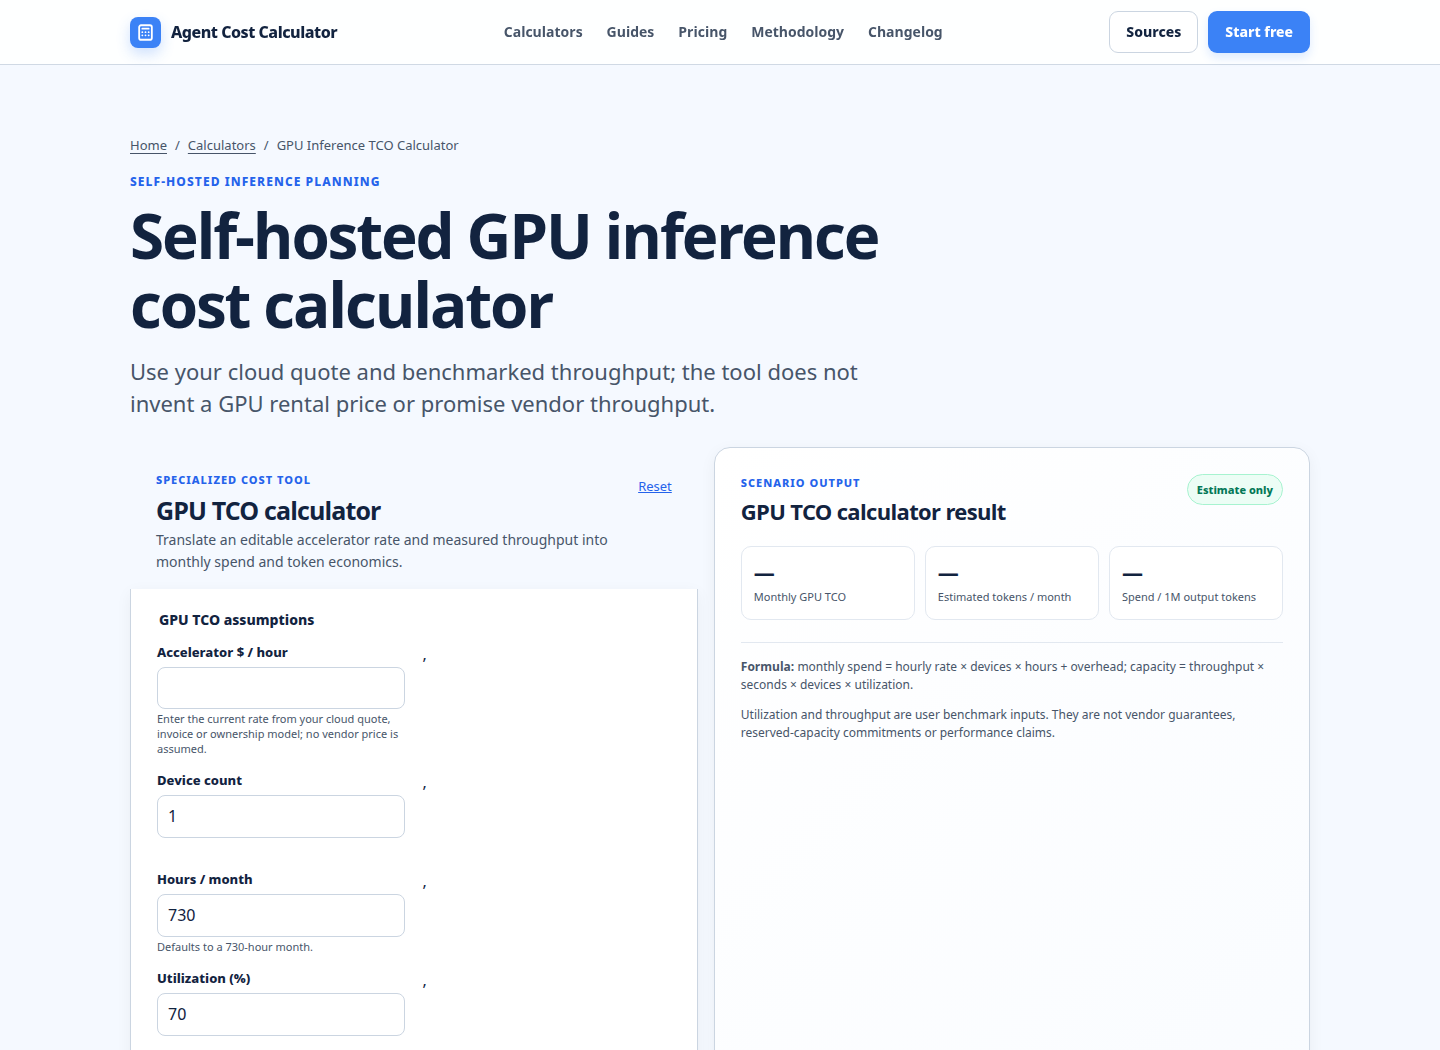
Monthly GPU TCO = hourly accelerator rate × device count × hours per month + monthly overhead Estimated monthly output tokens = measured tokens/second/device × seconds per month × device count × utilization Cost per 1M output tokens = monthly GPU TCO ÷ (estimated monthly output tokens ÷ 1,000,000)
Enter the current rate from your quote, invoice, or ownership model. Then enter measured throughput for the target model, quantization, batching, concurrency, and serving runtime. The tool intentionally does not invent a GPU price or generic tokens-per-second number. Utilization reduces the amount of useful work credited to paid capacity; it does not reduce the rental hours on the bill.
What the current results cover
I reviewed the first ten organic pages returned for the primary query, “GPU inference cost calculator,” on 2 November 2026 using a locale-limited web snapshot. This is a dated search sample, not a global ranking claim. Search volume, keyword difficulty, CPC, and broader demand are unverified; the site’s small three-month Search Console baseline is directional only.
The sample mixed formats: NVIDIA’s technical TCO article, interactive API-versus-GPU calculators, API price tables, monthly workload calculators, GPU sizing forms, token-speed simulators, long-form explainers, and static GPU tables. Controls commonly covered model, tokens, GPU type, quantization, context, utilization, or electricity. Several used illustrative rates or hardware-derived speed.
Freshness was uneven: several pages carried 2026 dates, while others were undated or used frozen tables. Depth ranged from short forms to articles with formulas, FAQs, and comparison tables. Visuals were mainly result cards, tables, sliders, and simulators. The pages generally focused on API pricing, hardware/model projections, or the cost-per-token formula.
The supportable gap in this snapshot is narrower: no sampled page combined a user-entered billing quote, measured aggregate serving throughput, explicit utilization math, and first-party guidance for collecting latency and token metrics in one provider-neutral TCO workflow. This guide and the calculator address that combination. That observation does not mean other pages do not rank elsewhere, rank for another variant, or change after this snapshot.
What this GPU inference calculator measures
- Accelerator $/hour: enter a current cloud quote, invoice-derived rate, or an ownership-equivalent hourly cost. Do not use a search result’s example price as if it were your contract.
- Device count: enter the devices that are paid for in the scenario. For a multi-GPU serving instance, use the full count, not only the card that seems to do most of the work.
- Hours/month: the default is 730 hours, but a schedule, reservation, or measured uptime may justify another value.
- Utilization: enter the share of provisioned capacity that turns into measured serving work. A 60% assumption means the model credits 60% of theoretical paid-time capacity, not that the provider charges only 60% of the month.
- Measured tokens/second/device: enter sustained output throughput for the target workload. This is not a hardware-specification estimate.
- Monthly overhead: optionally include power, storage, networking, CPU, orchestration, monitoring, support, licensing, or another recurring allowance.
The outputs are monthly GPU TCO, estimated monthly output-token capacity, and spend per 1M generated tokens. The default output unit is generated output tokens. Input processing influences the benchmark and latency, but the tool does not separately price prompt tokens. If your decision depends on input and output having different economic values, keep the GPU estimate separate and compare it with a compatible API scenario in the model pricing comparison or LLM cost calculator.
Why measured throughput matters more than a GPU label
NVIDIA’s inference TCO method starts with benchmarking a deployment unit under load, then using throughput and latency to size instances and servers. Its GenAI-Perf discussion identifies time to first token, inter-token latency, tokens per second, and requests per second as useful measurements. It also describes the trade-off between higher concurrency and higher throughput versus increased latency [1].
That is why a model name or GPU name is not enough. The result changes with architecture, quantization, prompt/output and context lengths, concurrency, batching, interconnect, runtime, and quality target. Batch-one throughput answers a different question from aggregate throughput under continuous batching.
vLLM makes this distinction visible in its production metrics. Its /metrics endpoint exposes prompt and generation-token counters, successful requests, queueing, end-to-end latency, time to first token, inter-token latency, per-request time per output token, and KV-cache usage [2]. Its per-request metrics can return queue time, generation time, mean inter-token latency, time to first token, and tokens per second, while warning that metric computation can add CPU overhead at high concurrency [3]. These are practical inputs for a measured scenario, not a promise that every deployment will reach the same result.
The vLLM benchmark command also lets you define a dataset and input/output lengths, warmups, number of prompts, and other serving parameters [4]. Use those controls to make the benchmark resemble production. Record the model revision, quantization, runtime version, device count, concurrency, prompt distribution, output distribution, and latency target beside the resulting throughput.
Utilization, latency, and redundancy change the economics
Utilization is the denominator adjustment that many simple GPU comparisons hide. A rented device can be paid for continuously while traffic arrives in bursts. If the GPU produces 180 tokens/second during busy periods but is effectively productive for only 60% of paid time, crediting 180 tokens/second for every second of the month understates cost per token by about 67%.
Latency creates a second constraint. Increasing concurrency can improve aggregate throughput, but it may also increase queue time, time to first token, or inter-token latency. A configuration that produces the most tokens per second is not automatically acceptable for an interactive product. Measure the highest throughput that still meets the target service level, then enter that measured value.
Redundancy affects the numerator even when it does not improve the denominator proportionally. Two active devices plus a hot standby can cost three devices’ worth of capacity, power, or rental. A standby that serves no traffic should not be credited with its own tokens/second. Put its recurring cost into the overhead allowance or model a scenario whose device count and measured throughput represent the same serving topology.
The cloud billing boundary matters as well. AWS states that EC2 On-Demand pricing is charged per instance-hour from launch until termination or stop, with partial Linux instance-hours billed per second [5]. Other providers, reservation terms, spot interruption rules, bare-metal contracts, and owned hardware use different boundaries. That is why the calculator asks for your rate instead of presenting a fabricated universal GPU price.
How to prepare inputs before calculating
- Define the workload. Name the model and revision, quantization, prompt and output distributions, context range, concurrency, batch or scheduling mode, and latency target.
- Warm up the serving stack. Exclude startup, model loading, compilation, and cache-warming effects unless they are part of the operating capacity you want to price.
- Measure at more than one load level. Capture a low-concurrency interactive case and the sustained concurrency that meets your p95 or p99 target. Aggregate output tokens per second across the devices that actually serve the requests.
- Join usage with serving metrics. Compare generated-token counters with request success, queue, TTFT, inter-token latency, and KV-cache behavior. A high token rate paired with unacceptable latency is not a valid production capacity number.
- Use the matching quote. The hourly rate must describe the same device count, region, billing tier, and reliability class as the measured deployment. Add recurring non-GPU costs rather than silently calling them free.
NVIDIA’s methodology likewise treats benchmarking as a prerequisite to sizing and TCO analysis [1]. Keep a benchmark file, invoice, or quote that can reproduce the entered assumptions.
Worked scenario: a measured 2-GPU deployment
Assumptions, not a vendor quote:
- Accelerator quote: $2.40 per device-hour
- Devices: 2
- Paid hours: 730 hours/month
- Measured sustained output: 180 tokens/second/device
- Utilization: 60%
- Monthly overhead: $350
First calculate monthly TCO:
($2.40 × 2 × 730) + $350 = $3,854/month
Using 2,628,000 seconds in a 730-hour month, estimated output capacity is:
180 × 2 × 2,628,000 × 0.60 = 567,648,000 output tokens/month
That is 567.648 million output tokens. Spend per million generated tokens is therefore:
$3,854 ÷ 567.648 = $6.79 per 1M output tokens
If the measured workload improves utilization to 80% without changing the quote, TCO remains $3,854, but credited output rises to 756.864 million tokens and cost falls to about $5.09 per 1M output tokens. That is the economic value of filling paid capacity; it is not a 20% discount on the hourly bill.
Treat this as scenario math, not a performance claim. Taxes, one-time engineering, model licensing, and API spend are outside it.
Run your scenario
Turn this framework into an editable estimate.
Use dated, source-linked assumptions and see cost per request, successful task and month.
Formula boundary and exclusions
The calculator is a transparent first estimate, not a full procurement model. It uses the hourly rate, device count, paid hours, utilization, measured throughput, and one overhead field. It does not fetch prices, select hardware, test model fit, validate quality, forecast traffic, or enforce an SLO.
Keep these items explicit in your own overhead or adjacent model:
- idle capacity caused by peak-to-average traffic, autoscaling headroom, or a warm standby;
- power, cooling, colocation, storage, CPU, networking, load balancing, and observability;
- orchestration, on-call, platform engineering, support, licenses, and depreciation;
- retries, failed requests, preemption, migrations, and model-download or storage costs;
- taxes, credits, reservations, spot interruptions, negotiated rates, and currency effects.
For a larger end-to-end workload, connect the result to the AI agent cost calculator, RAG cost calculator, or invoice reconciliation. The methodology page is useful for documenting the date, units, allocation rule, and exclusions behind the estimate.
FAQ
Does the calculator fetch a live GPU price?
No. You enter the current rate from your quote, invoice, or ownership model. Rates vary by provider, region, machine shape, reservation, spot status, and contract, so a generic number would create false precision.
What throughput should I enter?
Enter measured sustained output tokens per second per device for the same model, quantization, runtime, prompt/output mix, concurrency, batching policy, and latency target you intend to operate. Do not substitute a theoretical hardware specification or an unrelated single-request benchmark.
Does utilization reduce my cloud bill?
No. In this model, utilization reduces the amount of output capacity credited to paid GPU time. The hourly charge still follows the billing boundary of your provider or ownership model.
Does the result include input-token cost?
No. It estimates GPU TCO per generated output token using measured serving throughput. Prompt processing affects the measured workload and latency, but the tool does not apply a separate input-token price.
Should a redundant standby GPU count toward throughput?
Only if it serves the workload represented by the measured throughput. A paid standby that produces no tokens should contribute cost, not fictitious capacity. Put that cost in overhead or use assumptions that keep paid devices and serving devices consistent.
Is this a break-even comparison with an API?
Not by itself. It gives a self-hosted GPU unit cost. Compare it with a compatible API workload, model quality, input/output mix, latency target, reliability boundary, and non-model services before deciding between architectures.
Primary sources checked
Pricing and product behavior can change. These sources support the time-sensitive claims in this guide; verify current provider terms before committing spend.