Research-backed calculator guide
Self-Hosted LLM Staffing Cost: Budget MLOps, On-Call and Model Operations
Estimate the people cost of running a self-hosted LLM by allocating MLOps, SRE, evaluation, and governance work instead of treating labor as a hidden TCO line.
Quick answer
For a self-hosted LLM, staffing cost is the monthly value of the engineering time required to keep inference safe, available, measurable, and current. A practical first model is:
monthly staffing cost = sum(role FTE allocation × fully loaded annual role cost ÷ 12)
For an illustrative U.S. team, start with 0.25 FTE for an MLOps/platform owner, 0.10 FTE for SRE and on-call, 0.15 FTE for model evaluation and release work, and 0.05 FTE for security and governance. That is 0.55 FTE. If you anchor the loaded annual cost at $169,975 per FTE, the estimate is about $7,791 per month before GPU, power, storage, networking, software, or support costs.
The $169,975 figure is an explicit estimate, not a vendor quote or a published MLOps salary. It starts with the U.S. Bureau of Labor Statistics’ reported 2025 median annual wage of $135,980 for software developers, quality assurance analysts, and testers, then applies a 25% planning uplift for benefits, payroll taxes, and overhead.[2] The BLS occupation is a proxy, not a precise MLOps benchmark, so replace it with your internal compensation data or a local quote.
The important decision is not whether you need “one MLOps engineer.” It is how much recurring work your deployment creates. A quiet internal service may need 0.25–0.35 FTE. Multiple models, strict uptime, frequent releases, or 24/7 customer traffic can push the plan toward 0.75–1.0 FTE or a staffed rotation. Self-hosted LLM MLOps cost is therefore a workload and service-level assumption, not a fixed percentage of GPU spend.
What belongs in self-hosted LLM staffing cost?
A self-hosted LLM is an operating service, not only a downloaded model. The team has to provision compute, deploy a serving engine, set capacity limits, monitor latency and queueing, patch drivers and dependencies, evaluate model changes, and respond when the service fails. That ownership pattern follows directly from treating AI risk and trustworthiness as responsibilities across design, development, use, and evaluation rather than as a one-time deployment task.[1]
1. MLOps or platform ownership
This role owns the deployment path. Typical work includes container and image updates, GPU driver compatibility, model artifact management, rollout and rollback, capacity planning, secrets, access controls, and infrastructure-as-code. It also includes the unglamorous work of documenting how to restore service.
Budget more than initial setup time. The recurring work begins when a model or serving engine changes. A release is not complete because the container starts; it needs a benchmark, an evaluation result, a safe rollout, and a rollback path. Use a monthly FTE allocation rather than pretending those tasks disappear after launch.
2. SRE and on-call coverage
On-call cost is the reserve for incidents outside normal office hours. A single engineer who is “on call” without a backup is not a durable staffing plan. Include alert triage, queue backlogs, GPU failures, capacity exhaustion, failed deployments, and escalation time. If your service has a real 24/7 availability objective, model a rotation, contractor retainer, or managed operations fee instead of multiplying one person’s salary by an arbitrary percentage.
Your alert design should reflect inference behavior. vLLM documents metrics for successful requests, waiting requests, queue time, time to first token, end-to-end latency, preemptions, token counts, and KV-cache usage.[3] NVIDIA Triton similarly exposes request success and failure, pending requests, queue duration, compute duration, GPU power, utilization, and memory metrics.[4] Each metric is also an ownership obligation: someone must define thresholds, investigate anomalies, and decide whether to scale, shed load, roll back, or accept the degradation.
3. Evaluation and model operations
Model operations include regression sets, quality sampling, safety checks, prompt or adapter changes, quantization validation, and release sign-off. This can be a shared ML engineer or an application team, but it is still a cost of maintaining local AI server infrastructure. If the model is updated monthly, do not use the same evaluation allocation as a model frozen for six months.
Keep evaluation cost separate from inference compute. The GPU may be available, but human review, test maintenance, and failure analysis still consume time. Include extra work when a model serves regulated decisions or when quality regressions can create support or compliance incidents.
4. Security and governance
Security and governance work includes network isolation, identity and authorization, model and artifact provenance, retention rules, access reviews, incident response, and evidence for audits. NIST describes the AI Risk Management Framework as a way to incorporate trustworthiness considerations into the design, development, use, and evaluation of AI systems.[1] That framing matters for budgeting: governance is not a one-time procurement checkbox.
Telemetry also needs a privacy decision. OpenTelemetry’s GenAI observability guidance says metadata such as model names, token counts, and durations can be collected without prompt content by default, while full prompts, completions, and tool arguments require explicit opt-in.[5] Your staffing plan should include somebody who chooses the capture policy, reviews sensitive fields, and keeps dashboards useful without copying private data into every log.
Worked cost example: a 0.55-FTE inference team
Assume a U.S.-based production service with one open-weight model, weekday releases, a modest internal availability target, and an on-call escalation rather than a full staffed operations center. Use the BLS 2025 software occupation median as the base and apply a clearly labeled 25% planning uplift:
- Base annual wage: $135,980.
- Planning uplift: 25% × $135,980 = $33,995.
- Illustrative fully loaded annual cost: $169,975.
- Illustrative monthly cost per full-time equivalent: $169,975 ÷ 12 = $14,164.58.
| Responsibility | FTE allocation | Monthly calculation | Monthly staffing estimate |
|---|---|---|---|
| MLOps/platform ownership | 0.25 | 0.25 × $14,164.58 | $3,541 |
| SRE, incident response, and on-call reserve | 0.10 | 0.10 × $14,164.58 | $1,416 |
| Evaluation, release validation, and model operations | 0.15 | 0.15 × $14,164.58 | $2,125 |
| Security, privacy, and governance | 0.05 | 0.05 × $14,164.58 | $708 |
| Total | 0.55 | 0.55 × $14,164.58 | $7,791 |
This table is an original planning model. It is not a quote for a contractor, a promise that one person can cover all duties, or a claim that every deployment needs these exact fractions. It makes the assumptions inspectable so you can replace them.
Now convert labor into a workload metric. If the service processes 5 million tokens per day, a 30-day month contains 150 million tokens. The labor-only cost per million tokens is:
$7,791 ÷ 150 = $51.94 per 1M tokens
That number looks high because staffing is a fixed monthly cost spread over throughput. At 1 million tokens per day, the same team costs about $259.70 per million tokens. At 10 million tokens per day, it falls to about $25.97 per million tokens. This is why utilization and traffic shape matter more than a headline GPU hourly rate. The service can be cheap per token while still carrying an expensive idle team.
Use the Self-hosted GPU inference cost calculator for the hardware-hours and utilization side, then add this labor model rather than hiding people inside “overhead.” The calculator is an estimate tool: use your current cloud quote, invoice, ownership model, and measured throughput. It does not create a vendor price or guarantee performance.
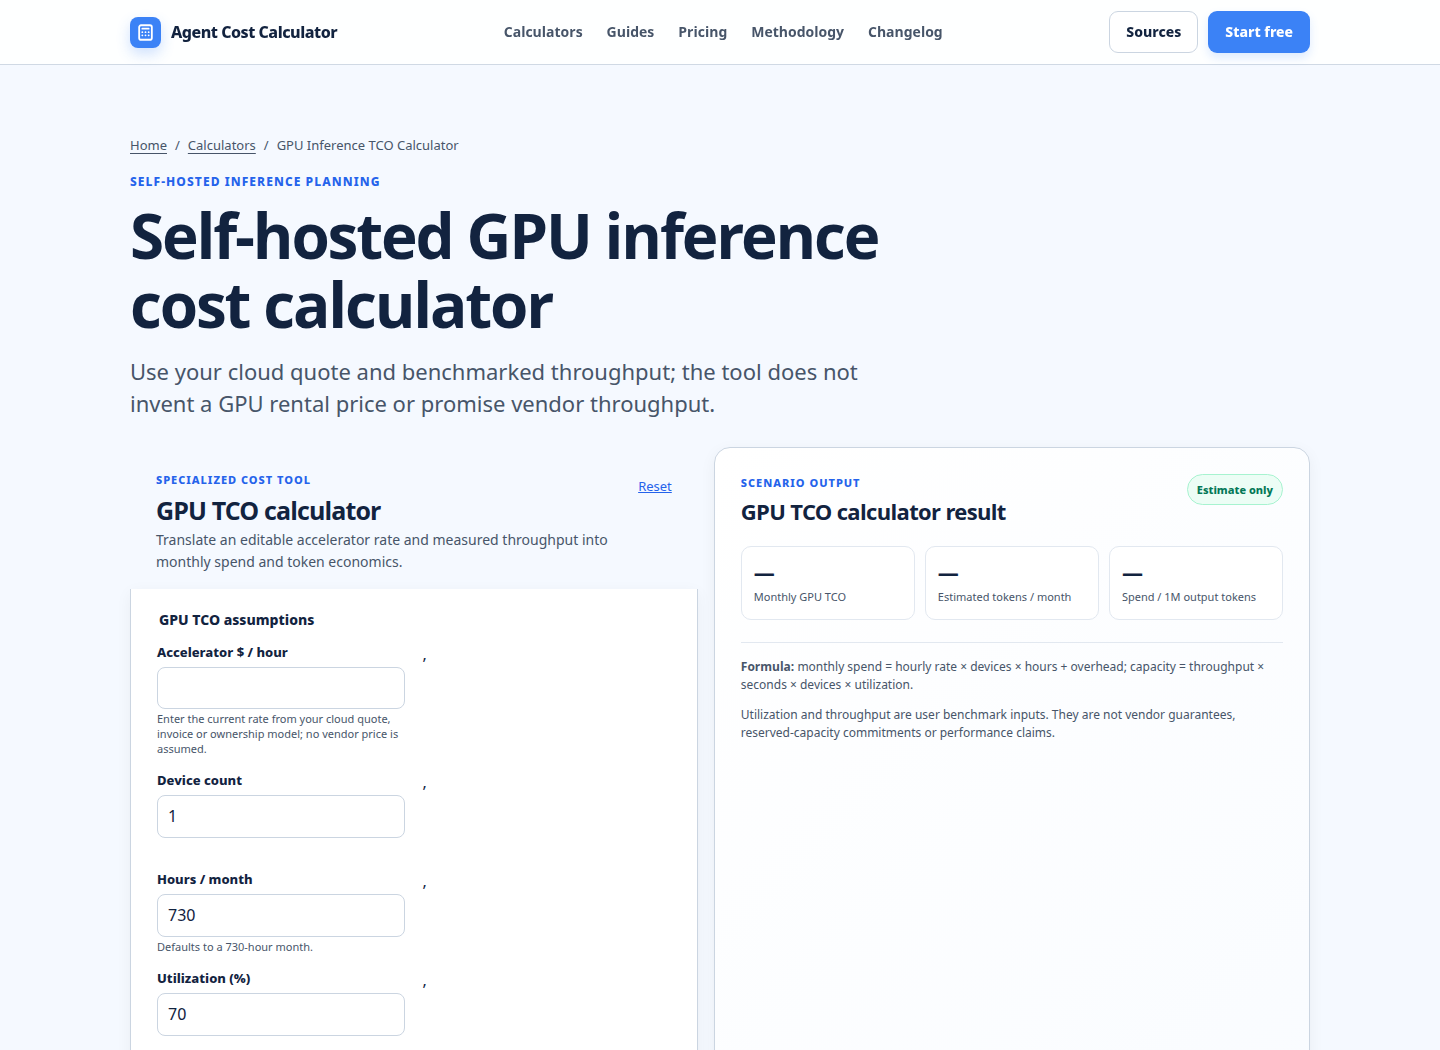
The screenshot demonstrates the complementary part of the model. Entering GPU hours and utilization can estimate compute capacity, but it does not estimate the people who patch, measure, evaluate, and support the service. Keep those two layers separate so a low GPU bill does not imply a low total operating cost.
Sensitivity: when the staffing estimate changes
Run at least three cases before approving a self-hosted deployment:
- Lean: 0.35 FTE for a low-risk internal service with one model, business-hours support, and infrequent releases. At the illustrative loaded rate, this is about $4,958 per month.
- Baseline: 0.55 FTE for one production service with a modest on-call reserve and recurring evaluation. This is about $7,791 per month.
- Resilient: 0.85 FTE for multiple models, more frequent changes, stronger incident coverage, and deeper governance. This is about $12,041 per month.
The resilient case is not automatically “better.” It is a way to expose the cost of a stronger service objective. If the business cannot tolerate a long outage, if the model handles sensitive data, or if releases happen weekly, the lean case may simply understate risk.
Do not count every adjacent team twice. If a central platform team already pays for cluster operations, allocate only the incremental inference work. If an application team owns prompt and evaluation work, record that allocation here or in the application’s cost model, but not in both. For API comparisons, the Model pricing comparison can help separate provider usage from the labor that remains on your side.
What this estimate excludes
This article’s $7,791 example is labor only. It excludes GPU rental or depreciation, electricity and cooling, colocation, storage, networking and egress, observability licenses, security tooling, model licenses, data labeling, training or fine-tuning runs, backup capacity, and the opportunity cost of engineers pulled from product work. It also excludes incident impact such as refunds, lost revenue, or customer support load.
It does not assume a specific GPU, model size, throughput, or token price. A GPU can be fully utilized while staffing remains unchanged. Conversely, a lightly used service can still need a meaningful on-call and security baseline. Use the AI agent development cost estimator when the deployment is part of a larger product build, and use the RAG, embedding and vector database cost calculator if retrieval infrastructure creates a separate operating surface.
Treat all dollar amounts above as estimates dated November 2, 2026. The BLS figure is a dated U.S. occupational median, not an MLOps-specific quote. The 25% uplift, FTE fractions, 30-day month, and token volumes are planning assumptions. Replace them with actual payroll burden, geography, contract rates, support coverage, measured traffic, and service objectives before making a purchase decision.
Run your scenario
Turn this framework into an editable estimate.
Use dated, source-linked assumptions and see cost per request, successful task and month.
FAQ
Is MLOps staffing cost separate from GPU cost?
Yes. GPU cost pays for capacity; staffing pays for the work that makes that capacity usable and dependable. Hardware amortization, GPU-hours, power, storage, networking, and labor can be combined in a TCO model, but they should remain separate inputs. This lets you see whether a cost change came from traffic, infrastructure pricing, or team effort.
How many MLOps engineers does a self-hosted LLM need?
There is no universal headcount. A single low-risk internal model may start with a 0.25–0.35 FTE allocation across an existing platform team. Customer-facing traffic, multiple models, strict latency, regulated data, frequent releases, or 24/7 support can require a larger allocation or a real rotation. Estimate responsibilities and coverage hours first; convert those requirements to people second.
Should on-call be priced as a percentage of salary?
A percentage is acceptable for an early scenario, but it is weak for a production commitment. Start with expected incident hours, escalation frequency, time zones, backup coverage, and any overtime or contractor rate. If the system must be supported continuously, price the rotation or managed service directly. A 0.10 FTE reserve in the worked example is a planning placeholder, not a guaranteed 24/7 schedule.
How do I calculate labor cost per million tokens?
Divide monthly labor allocation by monthly tokens in millions. For example, $7,791 per month divided by 150 million monthly tokens equals $51.94 per million tokens. Run the same calculation at low, base, and peak traffic. Fixed labor makes the cost per million tokens fall as utilization rises, but do not use that decline to justify insufficient reliability or governance.
Does observability reduce staffing cost?
It can reduce diagnosis time, but observability also creates ownership work. Track the metrics that expose queueing, latency, failures, token usage, GPU utilization, and cache behavior. vLLM and Triton both document these operational signals.[3] [4] OpenTelemetry can standardize model, token, and duration telemetry while allowing teams to keep sensitive content capture off by default.[5] The right question is whether the telemetry shortens detection and resolution enough to justify its tool and maintenance cost.
What is the biggest mistake in a self-hosted LLM staffing budget?
Treating launch as the finish line. Teams often budget model download and deployment but omit upgrades, evaluation, access reviews, incident drills, capacity tests, and the person who owns rollback. Put each recurring responsibility on a named team, assign an FTE fraction or external quote, and document what is explicitly out of scope.
Primary sources checked
Pricing and product behavior can change. These sources support the time-sensitive claims in this guide; verify current provider terms before committing spend.