Research-backed calculator guide
AI Observability ROI Calculator: Break-Even from Incident and Triage Data
Calculate observability break-even from measured incident frequency, triage time, labor rates, and separately labeled avoided-loss assumptions.
Quick answer
An observability investment breaks even when the value of measured response time saved plus any separately evidenced avoided loss is at least as large as the monthly observability cost. Start with the part you can audit:
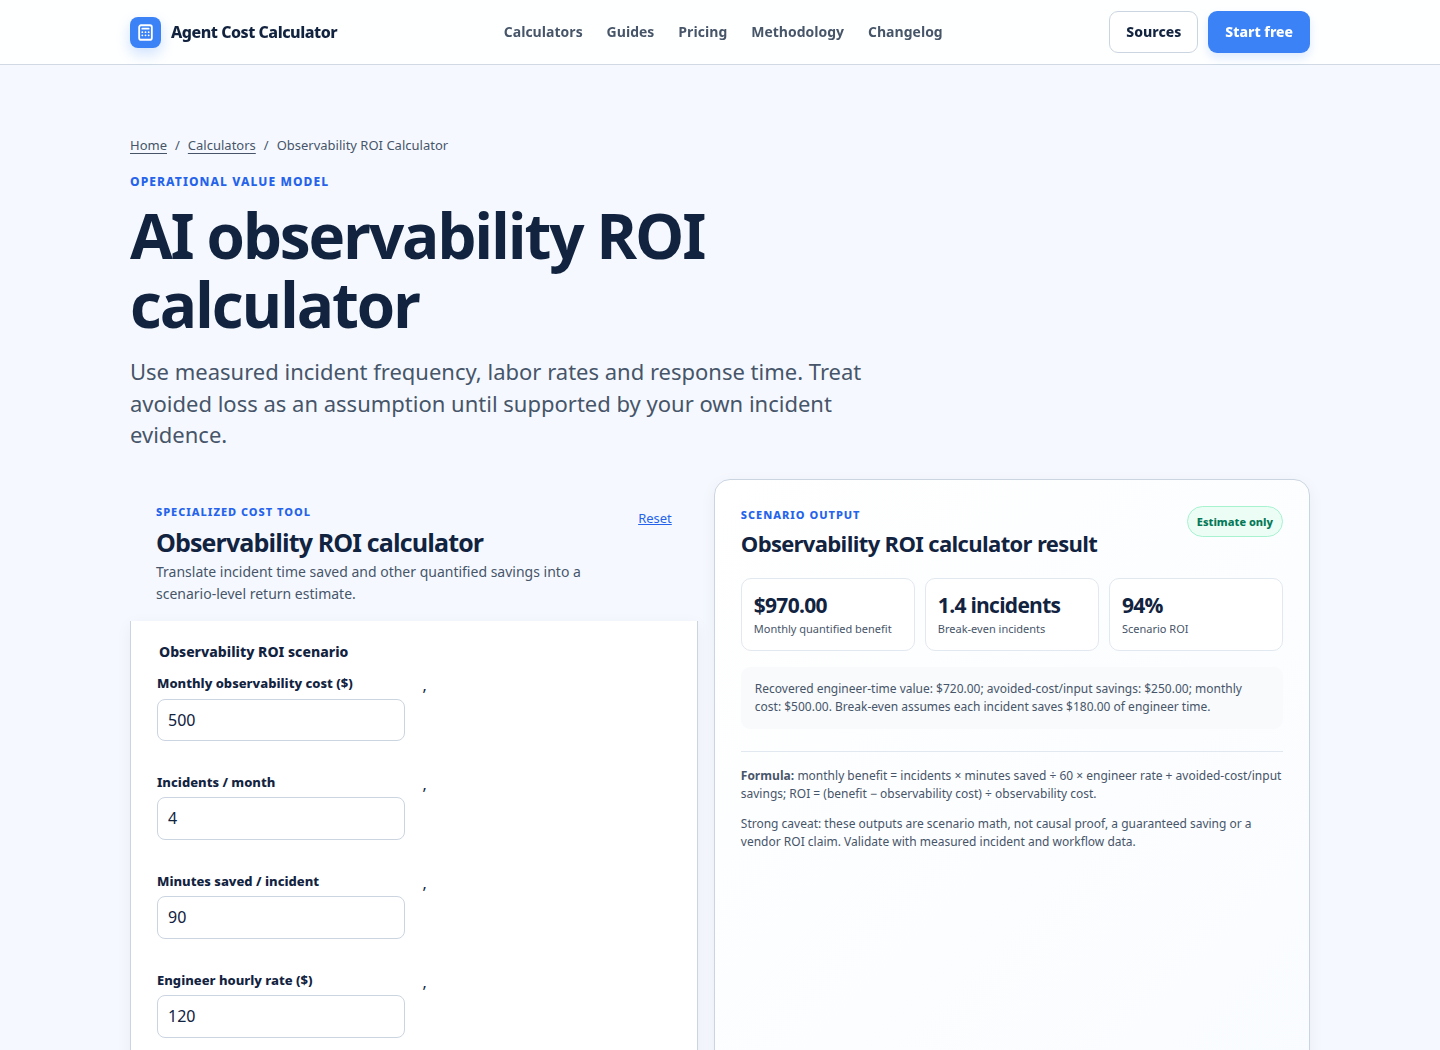
Monthly labor benefit = incidents per month × triage minutes saved per incident ÷ 60 × responders per incident × loaded hourly rate
Then calculate:
Net monthly benefit = measured labor benefit + separately modeled avoided loss − monthly observability cost ROI = net monthly benefit ÷ monthly observability cost × 100
Use the observability ROI calculator for the editable scenario. It is a planning estimate, not a guarantee that observability will prevent an incident or produce a particular return.
What this calculator should measure
A credible AI observability business case connects telemetry to a decision: how much recurring spend is justified by faster diagnosis and less operational loss? The narrowest defensible starting point is incident response and triage.
OpenTelemetry defines a trace as the path of a request through an application. A span represents one operation, and child spans can show the sub-operations inside a larger request [1]. That structure matters to ROI measurement because “the incident took two hours” is not enough. You need to identify the affected workflow, the failing operation, the time spent locating it, and the people pulled into the response.
The OpenTelemetry Collector can receive, process, and export traces, metrics, and logs. Its documented processing functions include batching, retries, encryption, and sensitive-data filtering [2]. Those capabilities can improve the quality and handling of evidence, but they are not automatically savings. Include their infrastructure, engineering, and storage costs in the expense boundary instead of assuming telemetry is free.
For an LLM application, one trace might represent an agent run or chatbot turn. Its observations can include model generations, tool calls, and retrieval steps. Langfuse describes a trace as the logical grouping of observations that share a trace ID, while observations represent individual steps [3]. This lets a team join incident records to the particular model call, tool, release, environment, or workflow that needs investigation.
Benchmark snapshot: what current results cover
On 2 November 2026, I reviewed the first ten English-language organic result pages surfaced for the query “observability ROI calculator” in a locale- and date-limited search snapshot. This is not a statement about global rankings or permanent SERP absence.
The set was dominated by vendor calculators and vendor-led value pages. Several asked for organization size, employee count, team scale, incident or action volume, salary, or industry, then returned annual savings, hours returned, capacity equivalents, payback, or an evaluation request. Other results were broad AI-agent or data-observability ROI explainers with formulas, templates, and long worked examples. One older technical result focused on custom metrics and dashboards rather than a break-even calculator.
The common strengths were clear input lists, scenario outputs, visual payback or savings sections, and explanations of hard versus soft savings. The common limitations were equally clear: many results model a named vendor, use benchmark defaults without a reproducible evidence trail, gate the final evaluation, or mix productivity, revenue, risk, tooling, and uptime into one headline number. Few make incident frequency, before-and-after triage minutes, responder count, and loaded labor the primary measured path while keeping avoided loss in a separate assumption ledger.
That is the supportable gap for this guide: a small, provider-neutral model that begins with the incident data an engineering team can export, exposes the break-even threshold, and prevents speculative risk reduction from masquerading as realized savings. It is a format gap in this dated snapshot, not proof that competitors do not rank elsewhere.
The inputs: use measured data first
1. Incident frequency
Enter the average number of qualifying incidents per month. Define “qualifying” before calculating: for example, production incidents that required an on-call engineer and a triage record. Use a trailing six- or twelve-month incident register if available. Do not count every alert as an incident unless the same definition is used in the baseline and the post-observability period.
For an AI system, useful filters include environment, service, model, agent workflow, severity, and release. Langfuse recommends stable trace and observation names, meaningful attributes, and environment labels so dashboards and evaluations remain usable as the application changes [6]. Those dimensions help you avoid comparing a noisy development stream with production incidents.
2. Triage minutes before and after
Record the median or mean minutes spent from the start of investigation to a sufficiently specific diagnosis. Pick one statistic and keep it consistent. If the old process used 90 minutes and the instrumented process uses 60 minutes, the measured saving is 30 minutes per incident.
Do not substitute total outage duration unless the telemetry actually changed detection or restoration. Triage time is the safer first measure because it is closer to the operational work the traces support. If you model detection, mitigation, or recovery separately, keep each interval separate so the same minutes are not credited twice.
3. Responders and loaded labor rate
Enter the average number of people whose triage time is included and a fully loaded hourly rate. The rate should match your organization’s finance definition and can include salary, benefits, payroll taxes, and allocated overhead. It is a user assumption, not a universal market rate.
If only one engineer actively investigated while two people attended a status call, count the investigation hours according to your stated rule. You can model coordination separately, but label it. A high hourly rate does not prove high value if the saved time is not redeployed or does not reduce spend.
4. Monthly observability cost
Use the complete recurring cost boundary: platform fee, usage overage, telemetry processing, storage, evaluation, support, and the allocated labor needed to operate the system. A plan fee alone is not total cost of ownership.
As a concrete public-plan example, Langfuse lists Hobby at no charge with 50,000 units per month, Core at $29 per month with 100,000 included units and $8 per additional 100,000 units, Pro at $199, and Enterprise at $2,499 [5]. Langfuse defines units as traces plus observations plus scores [4]. A trace with many generations, tool observations, and evaluation scores is therefore not one unit for billing purposes.
Use the observability cost calculator to estimate that usage boundary. If you send OpenTelemetry data through a Collector, add your measured compute and storage allocation. If an evaluation creates scores or additional observations, include them rather than hiding them under “free monitoring.” Langfuse also records usage and cost details for generations, which can help reconcile model spend with the trace that produced it [7].
Worked scenario: measured triage break-even
These are illustrative assumptions, not a benchmark or a vendor quote.
- Qualifying incidents: 8 per month
- Triage time before instrumentation: 75 minutes per incident
- Triage time after instrumentation: 45 minutes per incident
- Responders counted: 2
- Fully loaded labor rate: $110 per hour
- Monthly observability cost: $340.20
The time saved is 30 minutes per incident. The measured labor benefit is:
8 × (75 − 45) ÷ 60 × 2 × $110 = $880 per month
The labor-only net benefit is $880 − $340.20 = $539.80 per month. Labor-only ROI is $539.80 ÷ $340.20 × 100 = 158.7%, and the simple payback is $340.20 ÷ $880 = 0.39 months. This result says the measured triage-time scenario covers the entered monthly cost. It does not say that every team will reproduce it.
Now add an avoided-loss case, but keep it separate. Suppose the incident review records a one-in-twelve monthly probability of an escalation costing $12,000, and the team assigns only 25% attribution to observability-supported diagnosis. The expected avoided-loss value is:
1 ÷ 12 × $12,000 × 25% = $250 per month
With that assumption included, total modeled benefit is $1,130 per month. Net benefit is $789.80, and ROI is 232.2%. The $250 is not measured labor savings. It is an expected-value assumption that needs an incident postmortem, finance review, or other evidence. Present the labor-only case first and the combined case second.
Formula, exclusions, and double-counting controls
Use these variables:
- I = qualifying incidents per month.
- M₀ = baseline triage minutes per incident.
- M₁ = post-observability triage minutes per incident.
- R = responders included in the labor boundary.
- W = loaded hourly labor rate.
- C = monthly observability cost.
- A = separately modeled avoided-loss value per month.
The core calculation is:
Labor benefit = I × (M₀ − M₁) ÷ 60 × R × W ROI = (Labor benefit + A − C) ÷ C × 100
Exclude benefits that cannot be tied to the stated boundary. Do not count a shorter triage interval and the same shorter outage interval as two independent savings if they are the same minutes. Do not count engineer time as hard cash savings unless it reduces contractor spend, overtime, or an approved hiring requirement. If the team uses freed capacity for roadmap work, label it as capacity value and document the redeployment plan.
Likewise, do not add a revenue-protection estimate to an avoided-loss line when both use the same incident. Assign each incident one value category or split it with an explicit attribution rule. Keep implementation, migration, training, instrumentation, and one-time integration effort outside monthly run cost when calculating a recurring break-even; add them separately for a first-year payback view.
Run your scenario
Turn this framework into an editable estimate.
Use dated, source-linked assumptions and see cost per request, successful task and month.
How to validate the estimate after launch
Create a baseline before changing the instrumentation or workflow. Record incident count, severity, affected service, detection time, triage start, diagnosis time, restoration time, responders, and the trace or release identifier. After launch, compare like-for-like periods and account for seasonality, incident mix, staffing changes, and major architecture changes.
A good trace should expose the steps that matter to diagnosis. Langfuse recommends representing each model invocation as its own generation and keeping tool calls nested under the operation that requested them; aggregating an entire agent loop into one generation makes cost and failure analysis harder [6]. That is also a measurement rule: if the trace cannot distinguish model, tool, retrieval, and handoff work, it cannot support a precise triage or cost attribution claim.
Reconcile the estimate to actual invoices and platform usage with invoice reconciliation. Review the scenario monthly, then refresh it when pricing, retention, sampling, evaluation coverage, or incident definitions change. For broader workload economics, compare the AI agent cost calculator with the observability line kept visible rather than buried in overhead.
FAQ
Is observability ROI guaranteed?
No. The result is scenario math from entered costs and benefits. Observability can improve evidence and diagnosis, but it does not guarantee fewer incidents, shorter outages, or a financial return.
Should I use mean or median triage time?
Use the statistic that best matches your decision and state it. Median is often less distorted by an extreme incident; mean reflects total labor more directly. For a finance case, show both when the incident sample is large enough and explain which one drives the headline result.
What is the break-even point?
Break-even is the incident or time reduction needed for quantified benefit to equal monthly cost. Rearranging the core formula gives the required minutes saved per incident as C × 60 ÷ (I × R × W) when avoided loss is zero.
Should avoided revenue loss be included?
Only as a separate, documented assumption. Use an expected value based on event probability, cost per event, and an attribution share. Present a labor-only result and a combined result so speculative avoidance does not make measured productivity look larger.
Does a Langfuse trace equal one billable unit?
No. Langfuse defines billable units as traces plus observations plus scores. Use the provider’s usage dashboard or your measured counts, especially when a trace contains many model generations, tool calls, retrieval observations, or evaluation scores [4].
Can I count saved engineer hours as cash savings?
Only when the hours produce an approved financial outcome, such as reduced overtime, contractor spend, or an avoided hire. Otherwise, report them as capacity returned and apply a conservative redeployment rule rather than treating all capacity as cash.
Primary sources checked
Pricing and product behavior can change. These sources support the time-sensitive claims in this guide; verify current provider terms before committing spend.